Drawing a Rain Distribution Map of Chinese Mainland
A. Drawing a rain distribution map of Chinese Mainland
Steps:
Prepare Chinese Mainland’s map with the locations of different cities.
Students will work in groups to gather data regarding Chinese Mainland’s annual average rainfall of different areas, mainly northern, eastern, southern, western, and central.
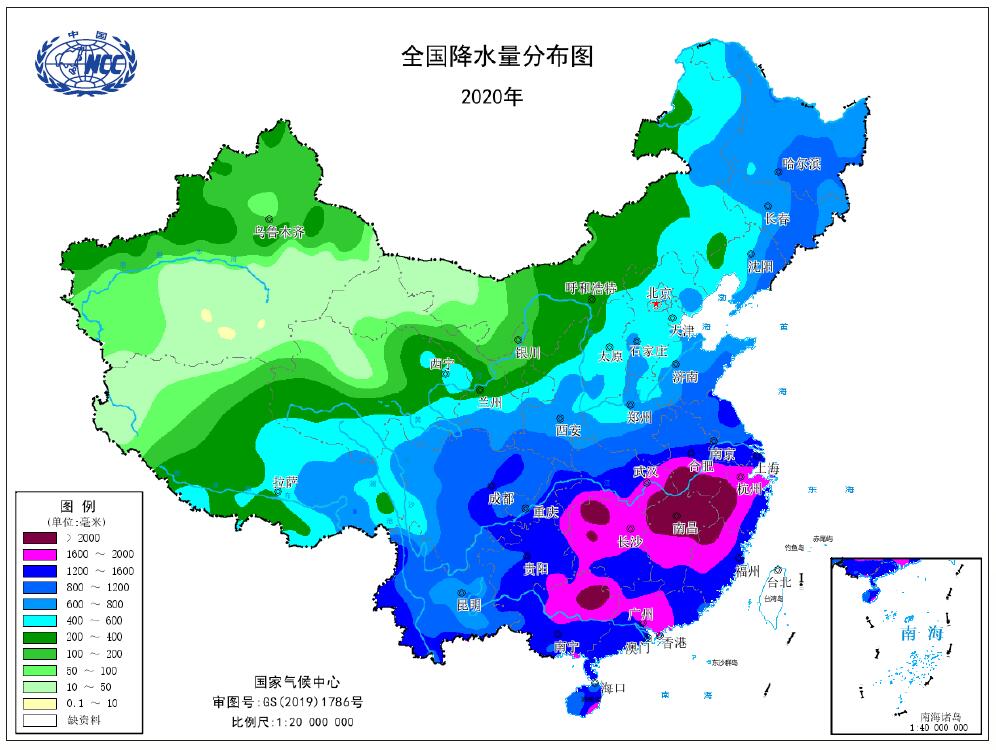
Use the data and color the map with different colors representing different amounts of rainfall, e.g. red=<50mm, deep blue=>1600mm, as shown from the example attached above.
Explore how rainfall is affected by factors like altitudes.
Example:
(Source: China Meteorological Administration)
B. Discussion
Which area has the highest precipitation? Which area has the lowest precipitation?
Describe rainfall distributions between different areas or cities.
How do the differences in annual rainfall inform Chinese Mainland’s water distribution problem?
What are some foreseeable challenges for Chinese Mainland regarding the rainfall and water distribution?